Receive a breakdown of your product’s sale performance with Payment Reports.
Let’s take a look!
Navigating to Payment Reports
Navigate to Reports > Products using the side-navigation menu within the Admin Dashboard.
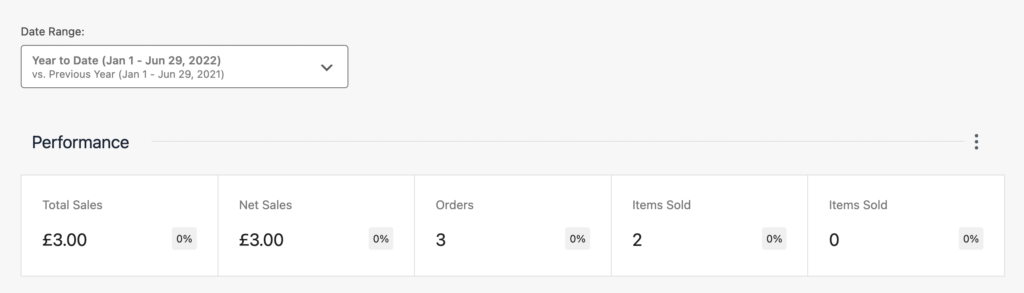
On this page, you’ll find various stats and graphs representing your sales data.
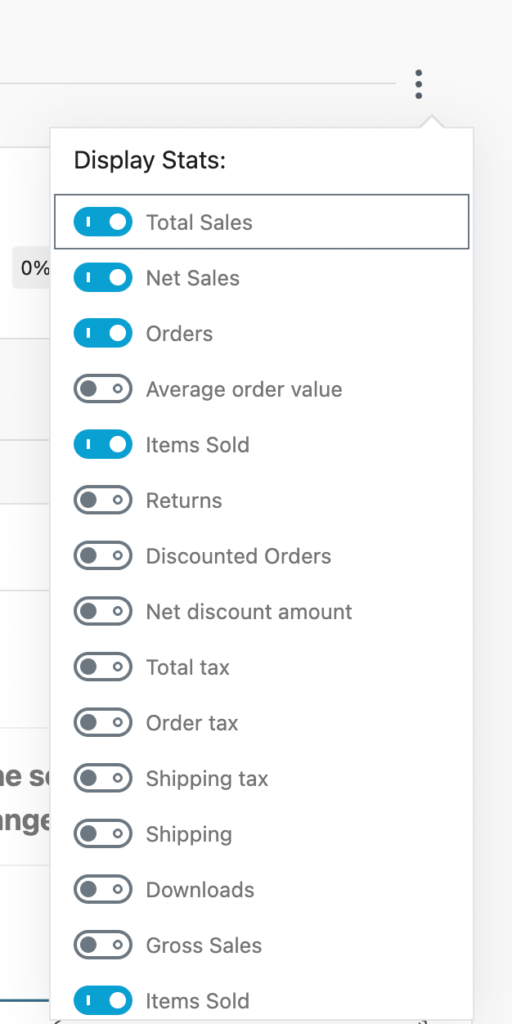
Using the 3 Dots you can display a variety of sales stats. Simply enable the stats you want to display.
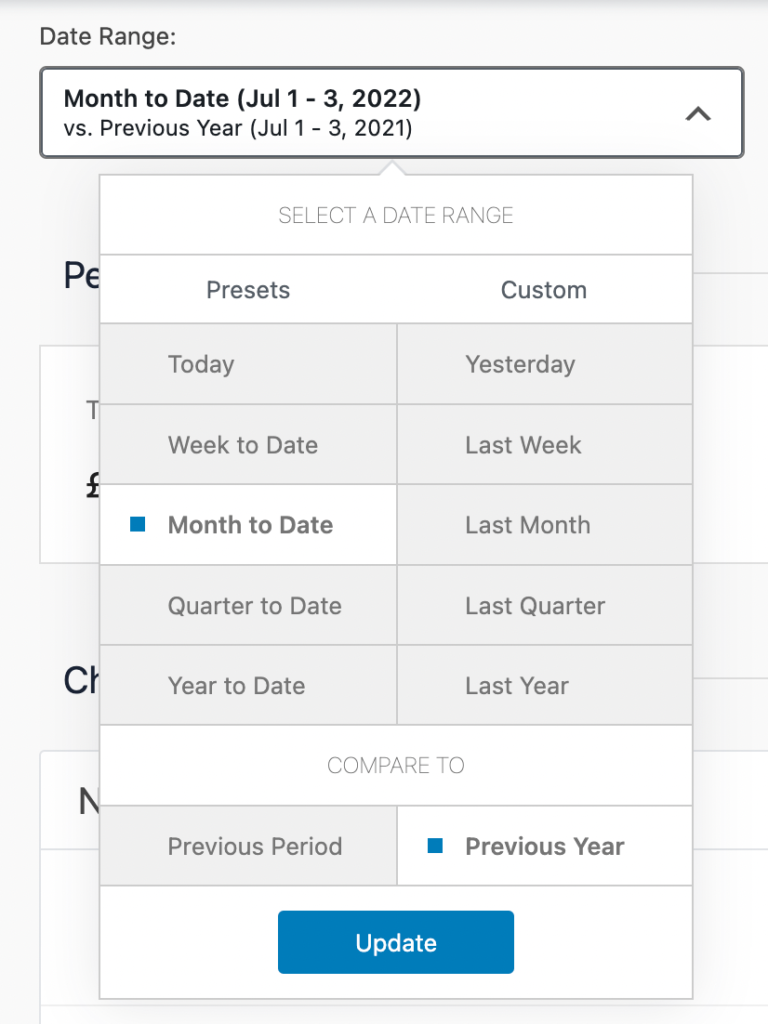
Using the Date Range filter you can select from the date Presets or set a Custom date range.
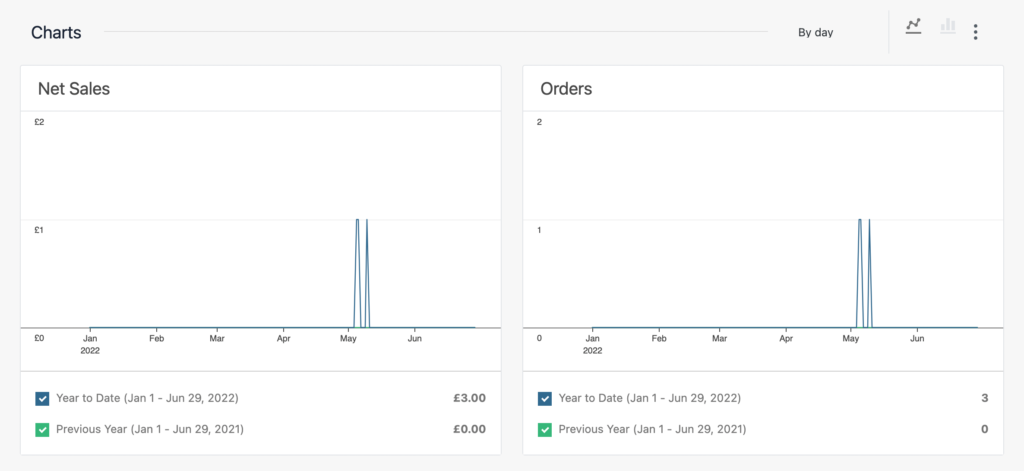
Further down the page, you can find charts representing the sales data. Similar to before, you can filter the graphs displayed by selecting the 3 dots.
Additionally, you can click on the Titles and Graphs to see a more detailed view of the data.
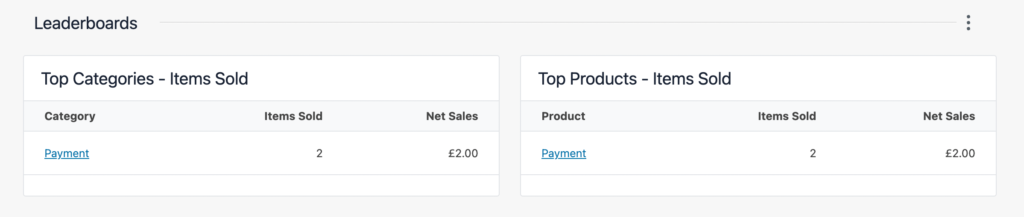
At the base of the Payment Reports, you can find the Leaderboards section which shows the Top Selling products, categories and more.
And that’s a wrap!